Operational intelligence for property management

Your whole property management business, in one clear view.

Lucent AI unifies your AppFolio, Rentvine or Buildium data, QuickBooks financials, and Gusto payroll into one board-ready dashboard, then benchmarks your margins, labor, and revenue per door against NARPM industry standards.

Built for property management companies running 50–500 doors on AppFolio, Rentvine or Buildium.
lucentai.us/demo · sample workspace
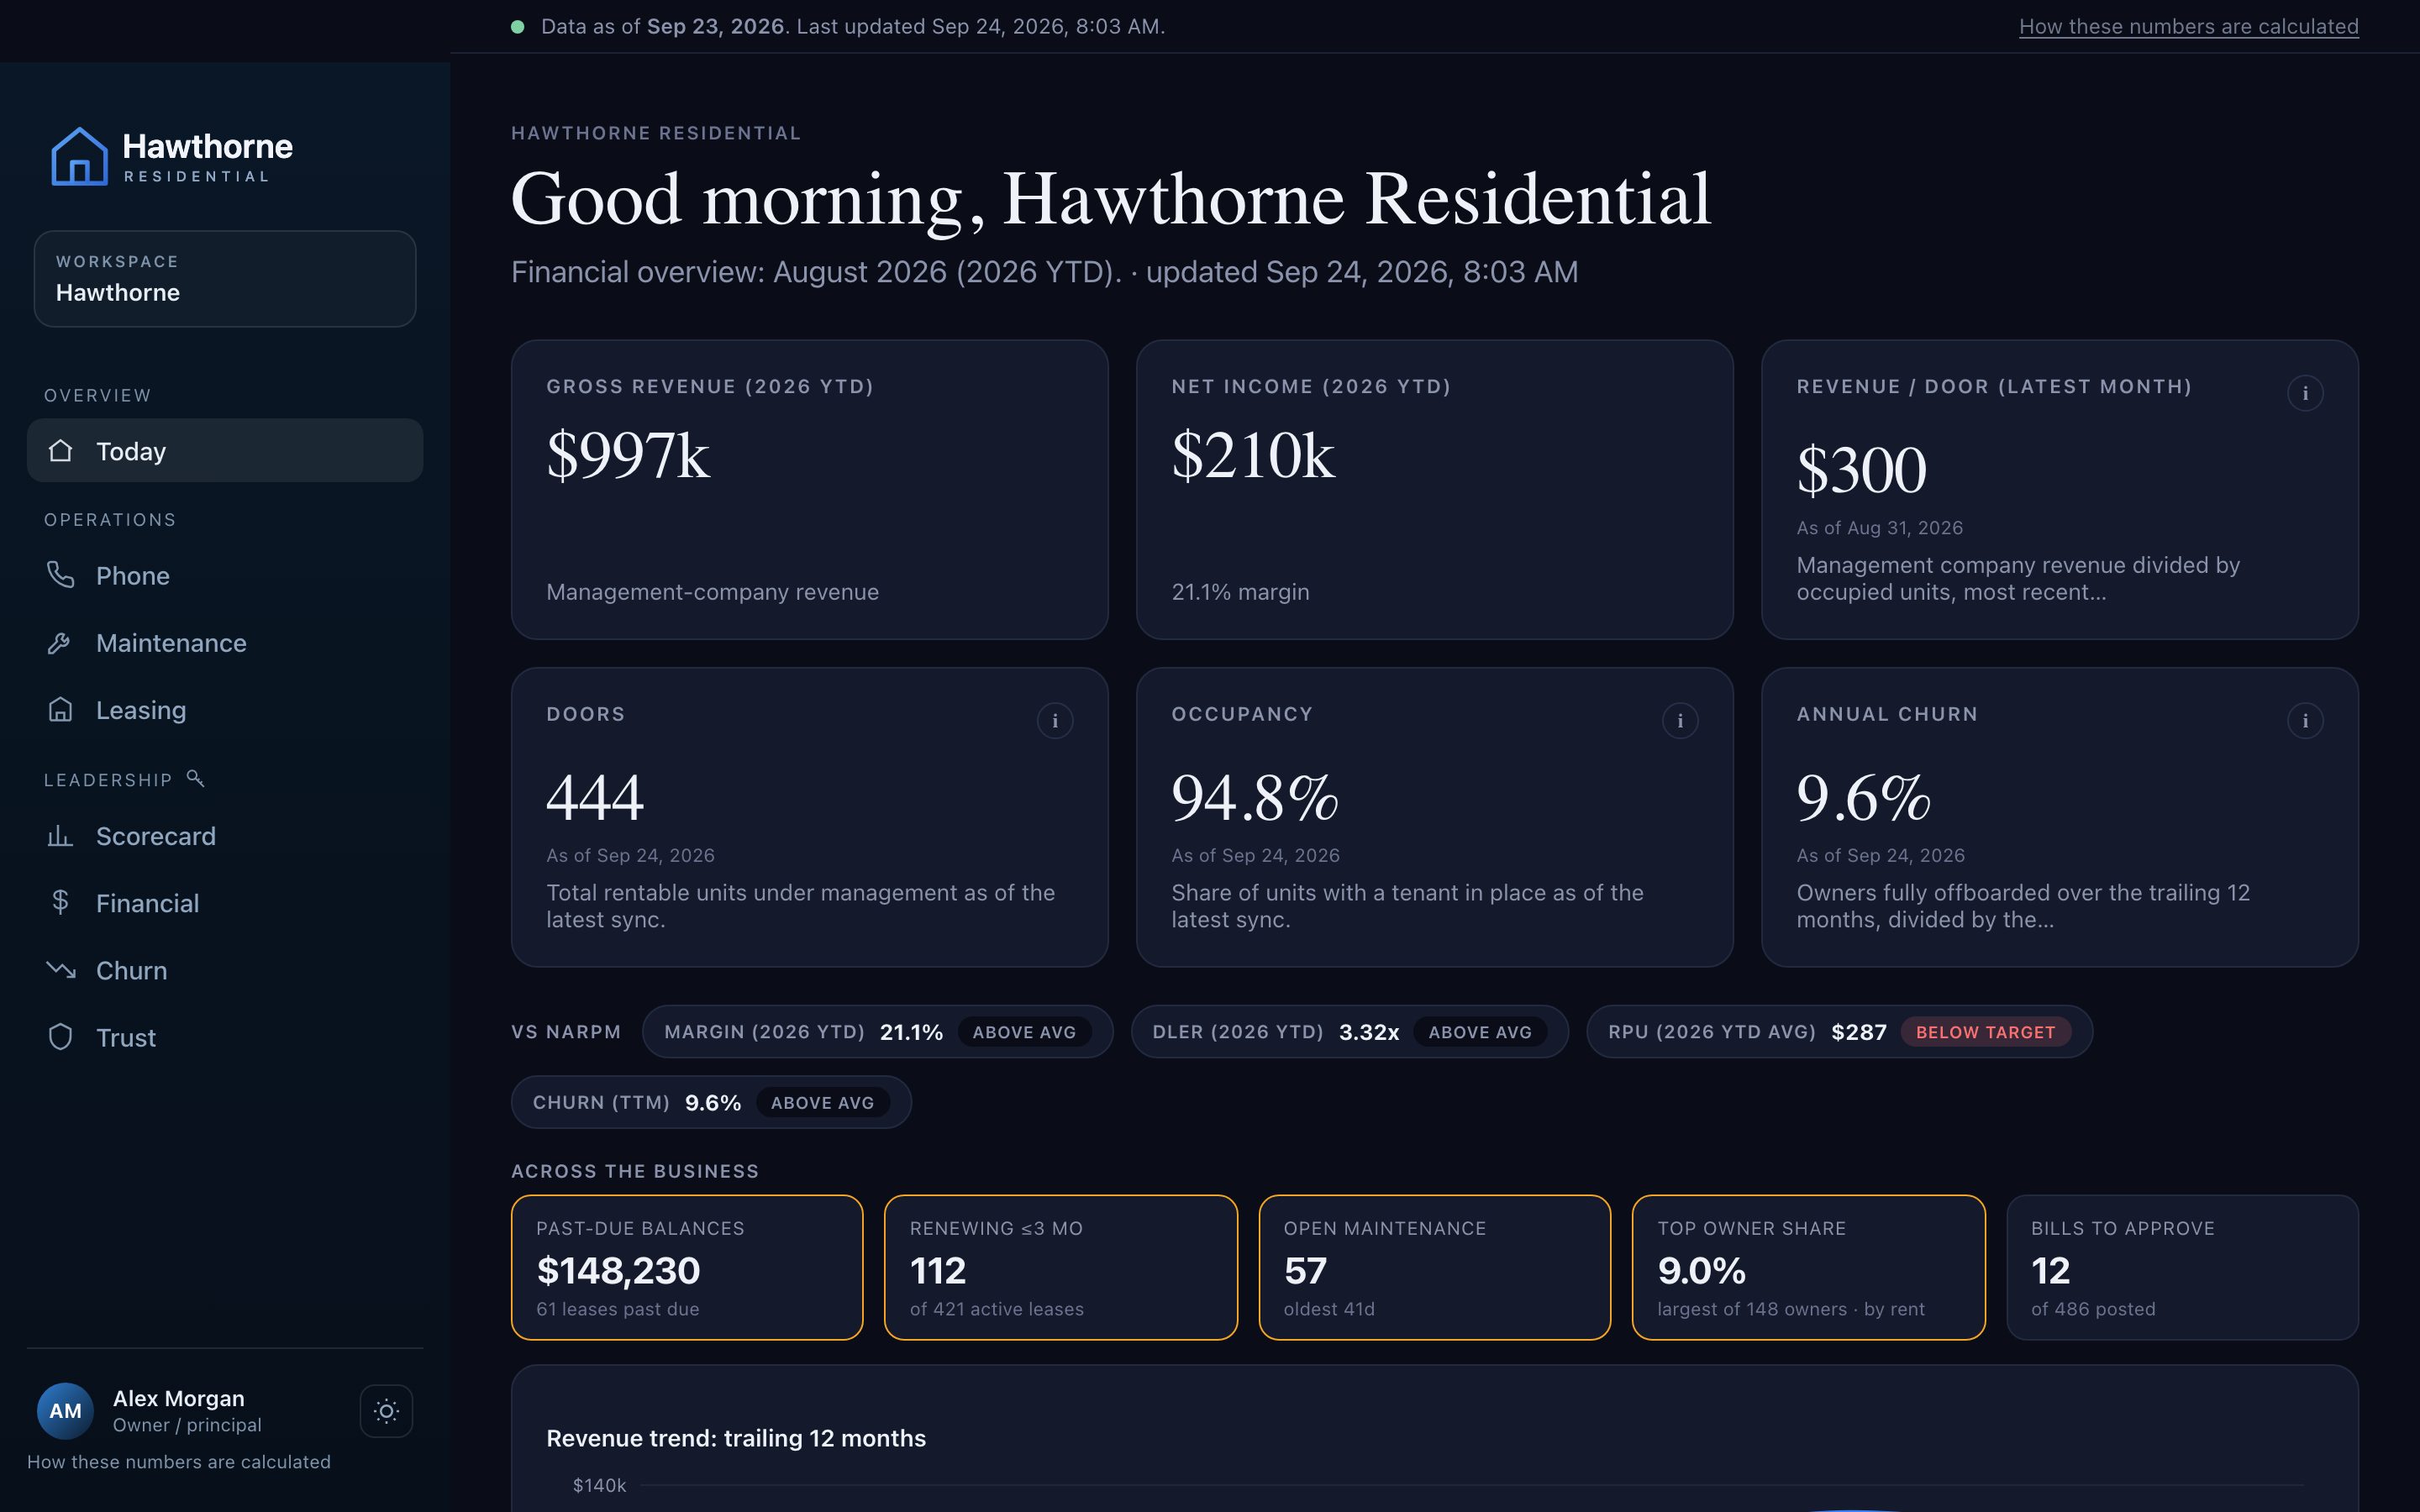
Lucent AI dashboard Today view for a sample property management company: gross revenue, net income, revenue per door, doors, occupancy and churn, each with its as-of date and definition, plus NARPM benchmark badges for margin, DLER and revenue per unit. Explore the live demo →
Connects AppFolio Rentvine QuickBooks Gusto Refreshed nightly
What it is

One operating picture, pulled from every system you already run.

Lucent AI is a financial and operational intelligence platform for property management companies. It connects your property management software (AppFolio, Rentvine or Buildium) with your QuickBooks accounting and Gusto payroll, and turns them into a single, white-labeled dashboard. Every number is reconciled back to its source, benchmarked against NARPM industry standards, and refreshed nightly, so principals can see the whole business without waiting on a month-end rollup, and trust what they see.

The scorecard

Benchmarked against the industry, not just last month.

Most property management reporting tells you what changed. Lucent tells you where you stand. Every dashboard scores your company against published NARPM financial-performance benchmarks, so you can see the gap between your numbers and the top operators in the industry.

BenchmarkIndustry averageTop-quartile operators
Property management profit margin11%32%
Direct Labor Efficiency Ratio (DLER)2.90x3.96x

Benchmarks sourced from NARPM Financial Performance data (via ProfitCoach). Your dashboard scores your own figures against these standards each month.

$317/door
Roughly the monthly management revenue per unit that top-performing property managers reach, a target, not an average.
11%
Average net profit margin across property management companies. Top-quartile operators run closer to 32%.
2.90x
Industry-average Direct Labor Efficiency Ratio. The best operators reach about 3.96x.
Data you can trust

Every number shows where it came from.

Principals stop using dashboards the first time a figure doesn’t match the report they pulled themselves. So every Lucent metric carries its definition, its source, its as-of time, and a reconciliation back to your AppFolio, Rentvine or Buildium report. If the numbers differ, the dashboard tells you why before you have to ask.

1

Defined once, agreed with you

Each metric has a written definition and formula, reviewed with your team, so “occupancy” means the same thing on every page.

2

Stamped with its source and as-of time

Every card shows which system the number came from and when it was pulled. Stale data is labeled, never silently shown.

3

Click through to the rows

Any figure drills down to the underlying records, with a link back to the matching report in your PMS.

4

Reconciled to your own reports

A bridge shows the walk from the raw PMS or QuickBooks figure to the dashboard value, line by line, so differences are explained rather than argued about.

5

Watched every night

Anomaly checks flag out-of-range values and the pipeline is reviewed each morning. Book restatements and gaps are surfaced to you, not buried.

Occupied doorsAs of Sep 23, 6:12 AM
Units with an active lease on the as-of date
412
Source: AppFolio Rent RollDefinition v3 · reviewed1 anomaly flagged
AppFolio rent roll, all units431
Less: vacant and notice-given−16
Less: excluded test and owner-held units−3
Occupied doors412
Illustrative. Drill-down shows all 412 rows and links to the report in AppFolio.
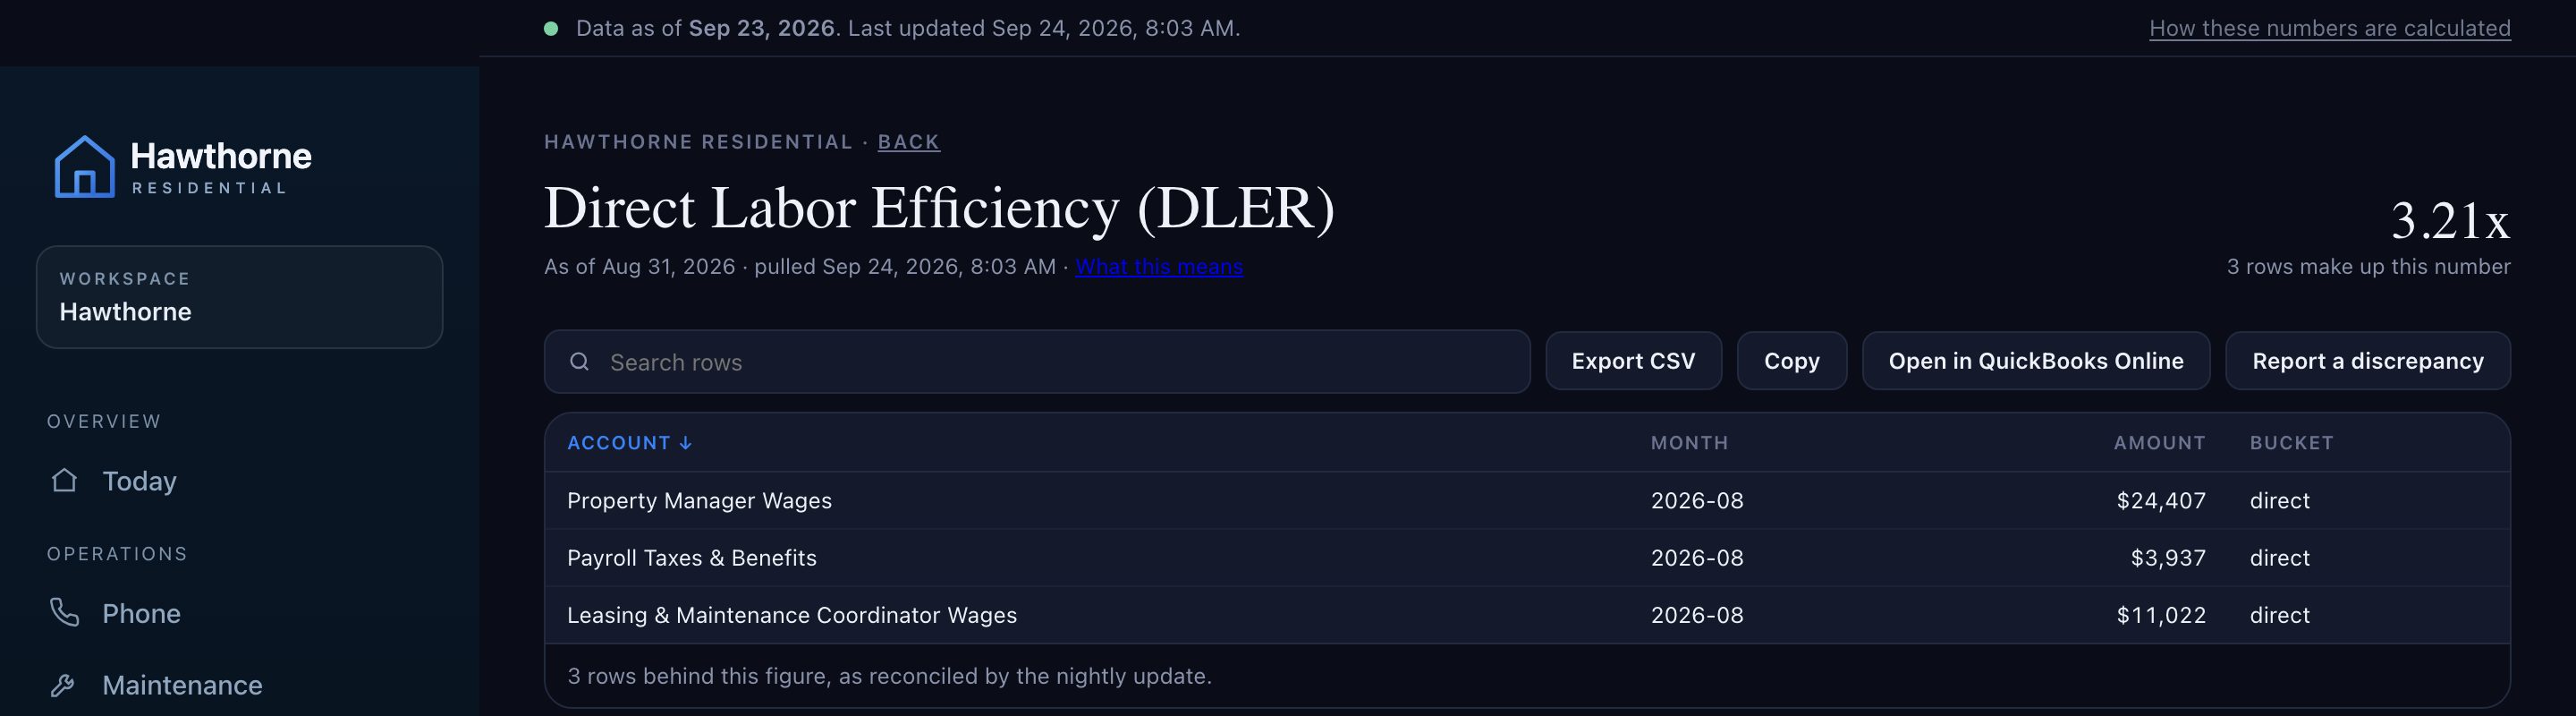
Drill-down: every number shows the rows behind it
Lucent AI drill-down for Direct Labor Efficiency Ratio, showing the as-of date, pull time, the payroll rows behind the figure, and buttons to export, open the source in QuickBooks Online, or report a discrepancy. Try a drill-down →
The platform

Start with the financials. Add what the principals keep asking about.

Every engagement starts with Lucent Core. From there, you turn on the modules that matter to your business, each one driven by your live data, with no spreadsheets or manual rollups.

Lucent Core

The financial overview and benchmarked scorecard. P&L, balance sheet, payroll efficiency, revenue and net per door, and your standing against NARPM benchmarks, reconciled and refreshed nightly. Required on every engagement.

Required

Telephony

Call volume, inbound and missed rates, response times, and per-team-member performance down to the hour of day.

Maintenance

Work-order throughput, SLA on-time rates, vendor grading and concentration risk, plus the live open work-order queue.

Leasing

Occupancy, renewals, vacancy, days on market, evictions, and the applicant pipeline, by property and by city.

Churn

Owner and door retention, onboarding and offboarding flow, and the concentration risk hiding inside your portfolio.

Remote Team

Visibility into remote staff activity and output, so distributed teams stay accountable against the same standards.

Business Development

Lead funnel, win/loss, source conversion, and a weekly plan that keeps the BDM accountable to a number.

How it works

Live in days, not quarters.

1

Connect your systems

We pull from AppFolio, Rentvine or Buildium, plus QuickBooks and Gusto. No new software for your team to learn and no change to how you already operate.

2

We build your dashboard

Lucent configures and white-labels the dashboard to your company, in an isolated environment, with your metrics and benchmarks set up for your portfolio.

3

Refreshed every night

Your numbers update automatically each night and are reconciled against the benchmarks, board-ready whenever a principal or owner asks.

Integrations

Built around the tools property managers actually run.

Lucent reads from your existing stack and brings it together. Your property management platform stays the system of record, Lucent becomes the executive layer on top of it.

Property management software
AppFolioRentvineBuildium
System of record. Read-only access.
Accounting and payroll
QuickBooks OnlineGusto
Phone systems
RingCentralZoom Phone
Telephony module
Leasing and lead CRM
AptlyLeadSimple
Leasing and Business Development modules
Team time tracking
Time DoctorHubstaffActivTrak
Remote Team module

On AppFolio, Rentvine or Buildium? Read the dedicated guides: AppFolio →  ·  Rentvine →  ·  Buildium →  or  ask us how it maps to your setup.

Pricing

One flat fee. Not per door.

Every plan includes Lucent Core, nightly refresh and the data trust layer. Add modules as your operation grows. Setup is one-time; annual billing saves 10%.

See full pricing →Modules a la carte from $49/mo. Customization from $120/hr.
FAQ

Questions property managers ask.

What is Lucent AI?

Lucent AI is a financial and operational intelligence platform for property management companies. It connects your property management software (AppFolio, Rentvine or Buildium), accounting (QuickBooks), and payroll (Gusto) into a single white-labeled dashboard, and scores your performance against NARPM industry benchmarks. Data is refreshed nightly.

Who is Lucent AI for?

Lucent AI is built for property management companies, typically managing between 50 and 500 units (doors), that run on AppFolio, Rentvine or Buildium. It is designed for owners and principals who need one clear operating picture across financials, leasing, maintenance, and payroll.

What systems does Lucent AI connect to?

Lucent AI connects to your property management software (AppFolio, Rentvine or Buildium), QuickBooks for accounting, and Gusto for payroll. It can also incorporate phone-system, maintenance, leasing, and business-development data depending on the modules you enable. The dashboard is refreshed nightly.

What is the Lucent scorecard?

The Lucent scorecard benchmarks your company against NARPM Financial Performance standards (via ProfitCoach). It compares your profit margin (industry average about 11%, top quartile about 32%), Direct Labor Efficiency Ratio or DLER (industry average about 2.90x, top quartile about 3.96x), and revenue per unit, so you can see where you stand against high-performing operators.

How is Lucent AI different from the reports built into AppFolio or Rentvine?

AppFolio, Rentvine and Buildium report on activity inside their own systems. Lucent AI unifies data across your property management software, accounting, and payroll into one board-ready view, adds industry benchmarking against NARPM standards, and delivers it as a white-labeled dashboard branded to your company. It is an executive operating picture, not another operational report.

How do I know the numbers in Lucent AI are right?

Every metric in Lucent AI carries a written definition, the source system it came from, the time it was pulled, and a reconciliation bridge back to the matching report in AppFolio, Rentvine, Buildium or QuickBooks. You can click any number to see the underlying rows. Anomaly checks run nightly and the pipeline is reviewed every morning, so stale or out-of-range data is flagged rather than shown silently.

Is the Lucent dashboard white-labeled?

Yes. Each dashboard is branded to your property management company and runs in an isolated environment per client. You can present it to owners and partners as your own owner-facing reporting.
See your portfolio on one page.

Book a 30-minute walkthrough. We’ll show you the dashboard on sample data, then map it to your AppFolio, Rentvine or Buildium setup. First dashboard live within days of read-only access.

Book a demo →